Performance parameters for chromatography columns
Reliable analyses can only be derived from columns that perform as expected. This can be checked by running standards. This needs to be done with a new column to determine the column’s initial performance and at regular intervals to detect performance changes. Furthermore, it serves to compare the capabilities of different columns. Here we outline which parameters are typically determined from such a standard analysis and what they describe.
Theoretical plates (efficiency)
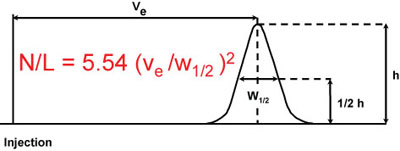
The term "theoretical plates" is borrowed from distillation. What stands for a separation stage in distillation, denotes the efficiency of the column in chromatography. The theoretical plates for a particular component are related to the elution volume and the width of the solvent peak as it appears on the chromatogram. Its calculation is shown in Figure 1. The number of plates behaves as follows: the higher the elution volume, the higher the theoretical plates of the column. Another influencing factor is the width of the peak: the narrower the peak, the higher the number of plates. Thus, it can be concluded that a high number of plates is associated with a high elution volume and narrow peaks and therefore denotes a high efficiency.
A parameter closely related to the theoretical plates is the height equivalent to a theoretical plate (HETP) which is calculated by dividing the column length by the number of theoretical plates (HETP = column length/N). It is an indicator of column performance independent from column length. The HETP decreases with increasing column efficiency.
Figure 1: Calculation of the number of theoretical plates
Asymmetry factor in chromatography
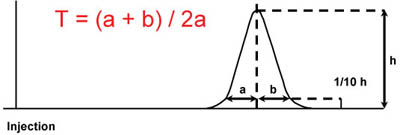
As the name indicates, the asymmetry factor describes how symmetrical a peak is and accordingly whether a peak has either fronting or tailing. It relates the distances from the center of the peak to the two flanks of the peak (Figure 2). Therefore, a perfectly Gaussian peak shape will result in an asymmetry factor of 1.0, whereas fronting peak is < 1 and a tailing peak is > 1.
Figure 2: Calculation of peak asymmetry
Resolution
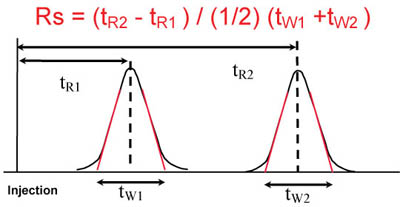
The resolution is a measure of how well two peaks are separated from each other. It takes into account the distance of the two peak centers as well as the width of both peaks (Figure 3). A low separation is indicated by resolution values of < 1.5, whereas resolution values of > 2 indicate baseline and good separation of two adjacent peaks.
Figure 3: Calculation of resolution
Retention time
The retention time is the duration a compound spends in the column from the injection to exiting the column. Changes in retention time can be an indicator of column contamination.