sec
SEC
17
ENZYMES
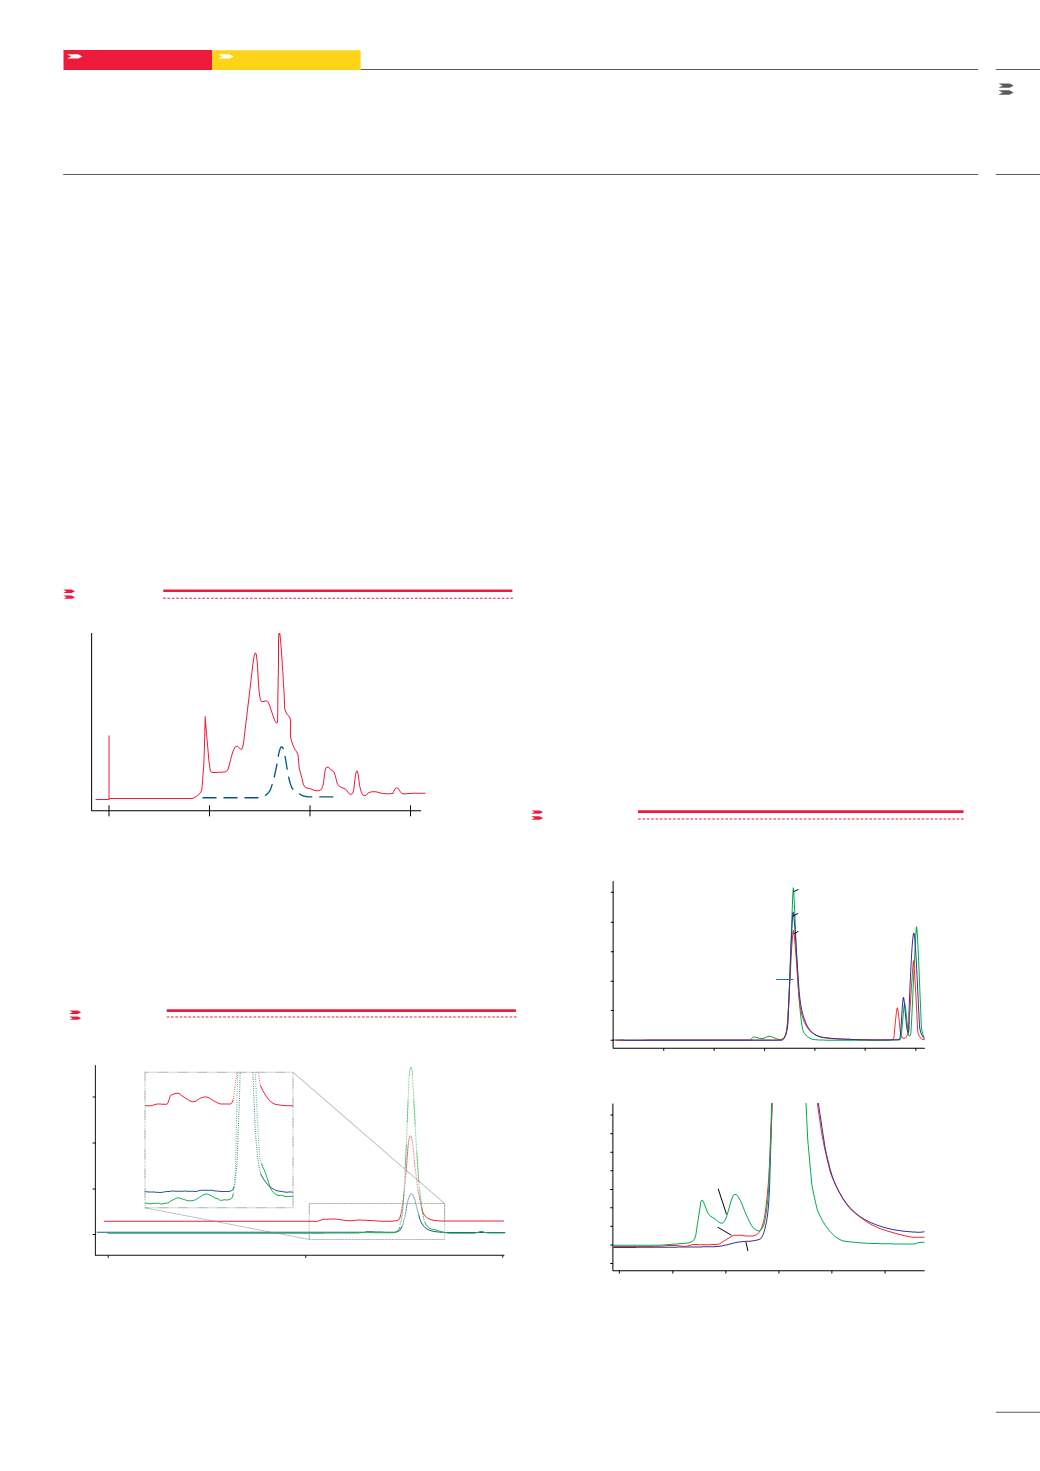
Mobile phase conditions in gel filtration are optimized to ensure little
or no interaction of the sample with the packing material. This gentle
technique allows for high recovery of enzymatic activity. A crude
sample of glutathione S-transferase was separated in only 15 minutes
on a TSKgel G3000SW
XL
column and activity recovery was 98% and
89%, respectively. The elution profile of the separation in
FIGURE 10
shows that all of the activity eluted in a norrow band of about 1.5 mL..
SEC-MALS ANALYSIS OF PROTEIN AGGREGATION
TSKgel G3000SW
XL
is the industry standard for aggregation analysis
in quality control of monoclonal antibodies.
FIGURE 11
depicts the
analysis of mAb Aggregates with UV, refractive index (RI) and multi
angle light scattering (MALS) detection.
HIGH RESOLUTION ANALYSIS OF FUSION PROTEINS
During method development, many variables are examined to ensure
method robustness. Factors such as elution profile, peak shape, and
recovery are required to be consistent. During a method re-qualification
several variables were investigated to eliminate non-specific binding
and increase the robustness of an established QC method using a
TSKgel SuperSW3000 column.
As shown in
FIGURE 12
, excessive peak tailing of “fusion protein 1” is
evident with the use of 0.2 mol/L NaCl (chromatogram C). Additionally,
the expected protein dimer and trimer aggregates are not visible.
By switching from 0.2 mol/L sodium chloride to 0.2 mol/L of the more
chaotropic sodium perchlorate salt, together with a two-fold reduction
in the buffer concentration, less peak tailing and distinct peaks for
the dimer and trimer species of mAb 1 resulted (chromatogram B).
Doubling the perchlorate concentration to 0.4 mol/L provided further
improvement in the peak shape of fusion protein 1 and associated
aggregate species (chromatogram A).
FIGURE 12B
is an enlargement of
the baseline region, showing an improved peak shape of the dimer and
trimer aggregates with the use of 0.4 mol/L NaClO
4
.
Crude glutathione S-transferase
0
10
15
5
Retention time (minutes)
Detector response (AU)
figure 10
Separation of crude protein sample on tskgel g3000sw
XL
Column: TSKgel G3000SW
XL
5 μm, (7.8 mm ID x 30 cm L); Sample: crude
glutathione S-transferase from guinea pig liver extract, 0.7 mg in 0.1 mL;
Elution: 0.3 mol/L NaCl in 0.05 mol/L phosphate buffer, pH 7;
Flow rate: 1.0mL/min; Detection: UV@220 nm (solid line) and enzyme assay
tests (dashed line); Recovery: enzymatic activity recovered was 89 %
figure 11
SEC-Mals-UV-RI analysis of mAb aggregates
0.15
0.10
0.05
0.00
0.0
5.0
10.0
time (min)
detectorvoltage (V)
Multimer
Dimer
Monoclonal
Column: TSKgel G3000SW
XL
column, 5 µm, 7.8 mm ID x 30 cm L
Sample: monoclonal antibody, Inj.volume: 20 µL;
Mobile phase: phosphate buffered saline (PBS); Flow rate: 1 mL/min;
Detection: MALS (red), refractive index (blue) & UV @ 280 nm (green);
HPLC System: LC-20A prominence, Shimadzu;
MALS detector: miniDAWN
TM
TREOS, Wyatt Techn. Corp.
figure 12
Overlays of antibody fusion protein analysis
mAU
1000
800
600
400
200
0
2
4
6
8
10
12
A
A
B
B
C
C
mAU
70
60
50
40
30
20
10
0
-10
4
5
6
7
8
9
A.
B.
fusion
protein1
Column: TSKgel SuperSW3000, 4 μm, 4.6 mm ID x 30 cm L;
Mobile phase: c: 0.4 mol/L NaClO
4
, 0.05 mol/L NaH
2
PO
4
, b: 0.2 mol/L NaClO
4
,
0.05 mol/L NaH
2
PO
4
, a: 0.2 mol/L NaCl, 0.1 mol/L NaH
2
PO
4
;
Flow rate: 0.35 mL/min; Detection: UV @ 214 nm; Injection vol.: 5 μL;
Samples: antibody fusion protein


