SEC
12
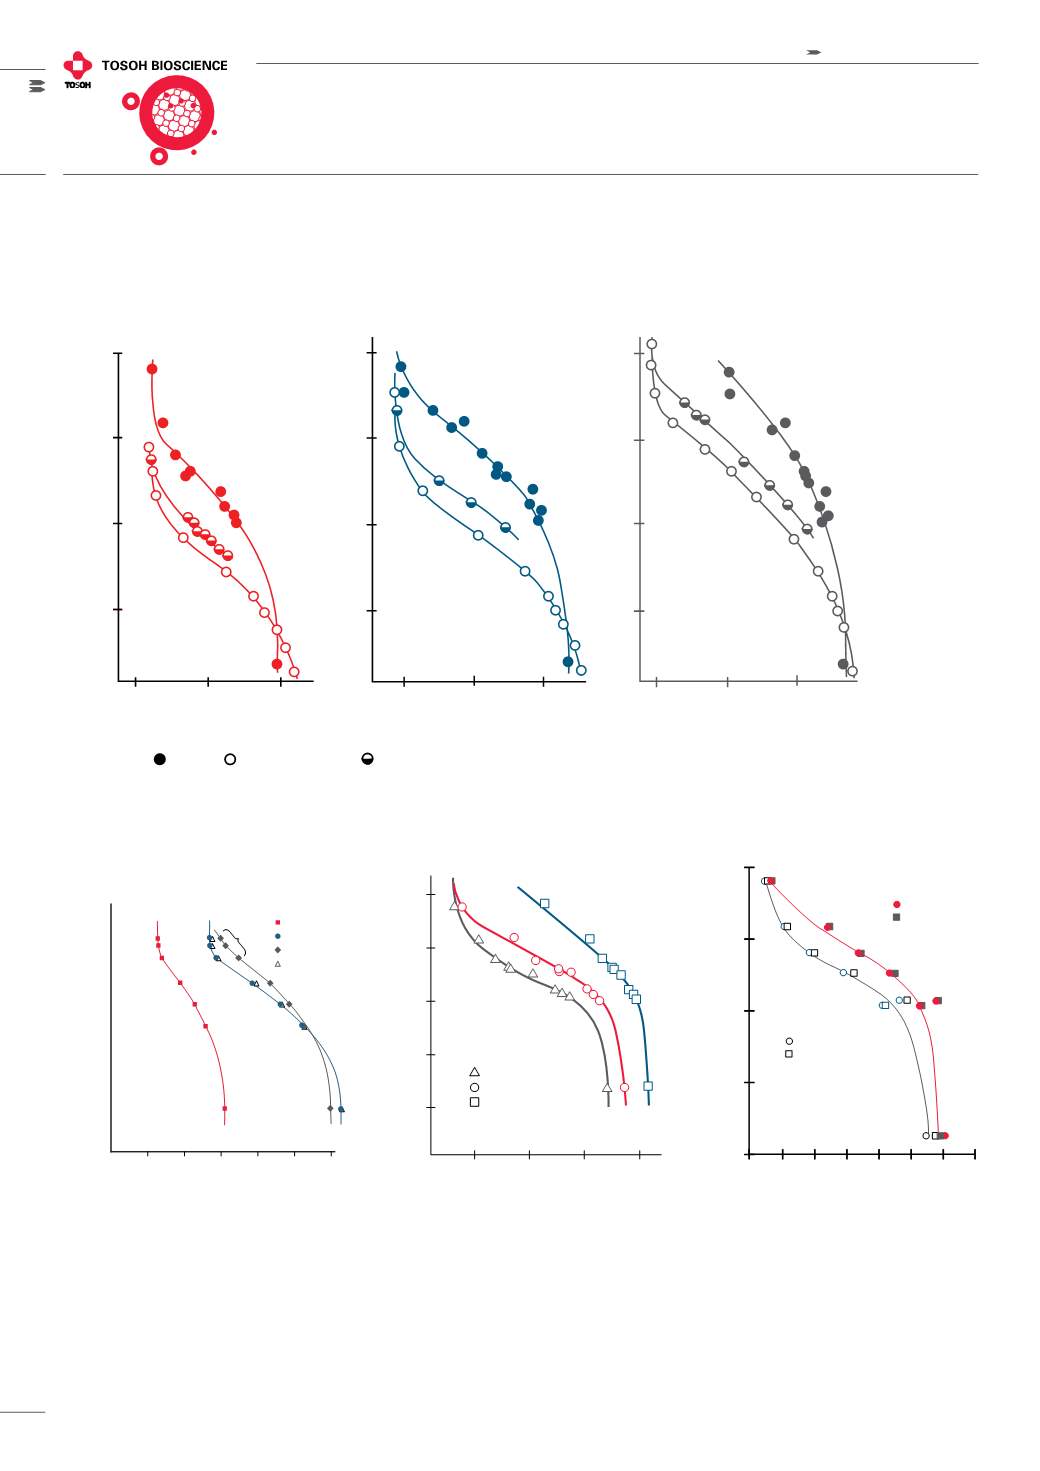
Calibration curves for TSKgel SW-type Gel Filtration columns
Polyethylene oxide, dextran and protein calibration curves for TSK-GEL SW columns
TSKgel G2000SW
TSKgel G4000SW
TSKgel G3000SW
Column:
Sample:
Elution:
Flow Rate:
Detection:
10
6
Molecular weight (Da)
10
5
Elution volume (mL)
Elution volume (mL)
TSK-GEL SW, two 7.5 mm ID x 60 cm L columns in series
proteins, polyethylene oxides, dextrans
dextrans and polyethylene oxides: distilled water; proteins: 0.3 mol/L NaCl in 0.1 mol/L phosphate buffer, pH 7.0
1.0 mL/min
UV @ 220 nm and RI
40
20
30
40
20
30
10
6
10
6
10
5
10
5
10
3
10
3
10
4
10
4
10
4
10
3
40
20
30
Elution volume (mL)
Protein calibration curves for TSK-GEL SW
XL
columns
TSKgel G2000SW
XL
TSKgel G3000SW
XL
TSKgel G4000SW
XL
Elution volume (mL)
6
10
12
Columns:
Sample:
Elution:
Detection:
TSKgelSW
XL
, 5 or 8
µ
m, 7.8 mm ID x 30 cm L
1. thyroglobulin (660,000 Da); 2. IgG (160,000 Da)
3. BSA (67,000 Da); 4. ovalbumin (43,000 Da);
5. peroxidase (40,200 Da); 6.
β
-lactoglobulin
(18,400 Da); 7. myoglobin (16,900 Da)
8. ribonuclease A (12,600 Da);
9. cytochrome C (12,400 Da);
10. glycine tetramer (246 Da)
0.3 mol/L NaCl in 0.1 mol/L sodium
phosphate buffer, pH 7.0
UV @ 220 nm
10
2
10
3
10
4
10
5
10
6
1
3
5
7 8
6
4
9
2
10
Molecular weight (Da)
8
5 6 7 8 9 10 11 12
Minutes
Calibration curves for TSK-GEL SuperSW and SW
XL
Columns:
Sample:
Elution:
Flow rate:
Temperature:
Detection:
TSKgel SWXL, 5µm, 7.8 mm ID x 30 cm,
TSKgel SuperSW, 4 µm, 4.6 mm ID x 30 cm
proteins: 1. thyroglobulin (660,000 Da);
2.
γ
-globulin (150,000 Da); 3. BSA (67,000 Da);
4.
β
-lactoglobulin (18,400 Da); 5. lysozyme
(14,500 Da); 6. cytochrome C (12,400 Da);
7. triglycine (189 Da)
0.15 mol/L phosphate buffer (pH 6.8)
0.35 mL/min for SuperSW; 1.0 mL/min for SW
XL
25
°
C
UV @ 280 nm (220 nm for triglycine)
10
2
10
3
10
4
10
5
10
6
Molecular weight (Da)
SuperSW2000
G2000SW
XL
SuperSW3000
1
2
3
4
5
6
7
G3000SW
XL
The best results are obtained when selecting a column with the sample’s molecular weight in the linear portion of the calibration curve.
Polyethylene oxide, dextran and protein calibration curves for tskgel sw columns
0
2
4
6
8
10
12 min
SuperSWmAbHTP
SuperSWmAbHR
UltraSWAggregate
G3000SW
XL
Log MW
7
6
5
4
3
2
1
1
2
3
4
5
Columns:
TSKgel SuperSWmAb HTP, 4 µm, 4.6 mm ID × 15 cm
TSKgel SuperSW mAb HR, 4 µm
TSKgel UltraSW Aggregate, 3 µm
TSKgel G3000SW
XL,
4 µm, (all 7.8 mm ID × 30 cm)
Sample:
1. Thyroglobulin (MW 640,000), 2.
g
-Globulin
(MW 155,000), 3. Ovalbumin (MW 47,000),
4. Ribonuclease A (MW 13,700),
5. p-Aminobenzoic acid (MW 137)
Mobile phase: 0.2 mol/L phosphate buffer, pH 6.7, 0.05% NaN
3
Flow rate:
1.0 mL/min, 0.35 mL/min (SuperSW mAb HTP)
Temp.:
25°C
Detection:
UV @ 280 nm
Inj. vol.:
10 μL, 5 μL (SuperSW mAb HTP)
Calibration curves for tskgel SW columns


