58
AFC
Protein a Affinity
chromatography
The binding of the enhanced rProtein A ligand to the
TOYOPEARL base bead via multipoint attachment is not
only resulting in high alkaline stability but also the reason
for low ligand leakage (Table 1).
Achievement of high linear velocities at relatively low pres-
sure enables high throughput at production scale using
equipment with moderate pressure limitations (Figure 6).
figure 6
0.00
0.05
0.10
0.15
0.20
0.25
0.30
0.35
0
100
200
300
400
500
600
700
800
Detector response (MPa)
Flow rate (cm/hr)
1.0 cm ID
2.1 cm ID
4.4 cm ID
9.0 cm ID
10.0 cm ID
Column sizes:
1.0 cm ID, 2.1 cm ID, 4.4 cm ID, 9.0 cm ID, 10.0 cm ID
20 cm normalized bed height
Mobile phase: DI H
2
O
Detection:
pressure (MPa)
Column size: 1.0 cm ID, 2.1 cm ID, 4.4 cm ID, 9.0 cm ID, 10.0 cm ID;
20 cm normalized bed height; Mobile phase: DI H
2
O
Pressure/Flow Curve
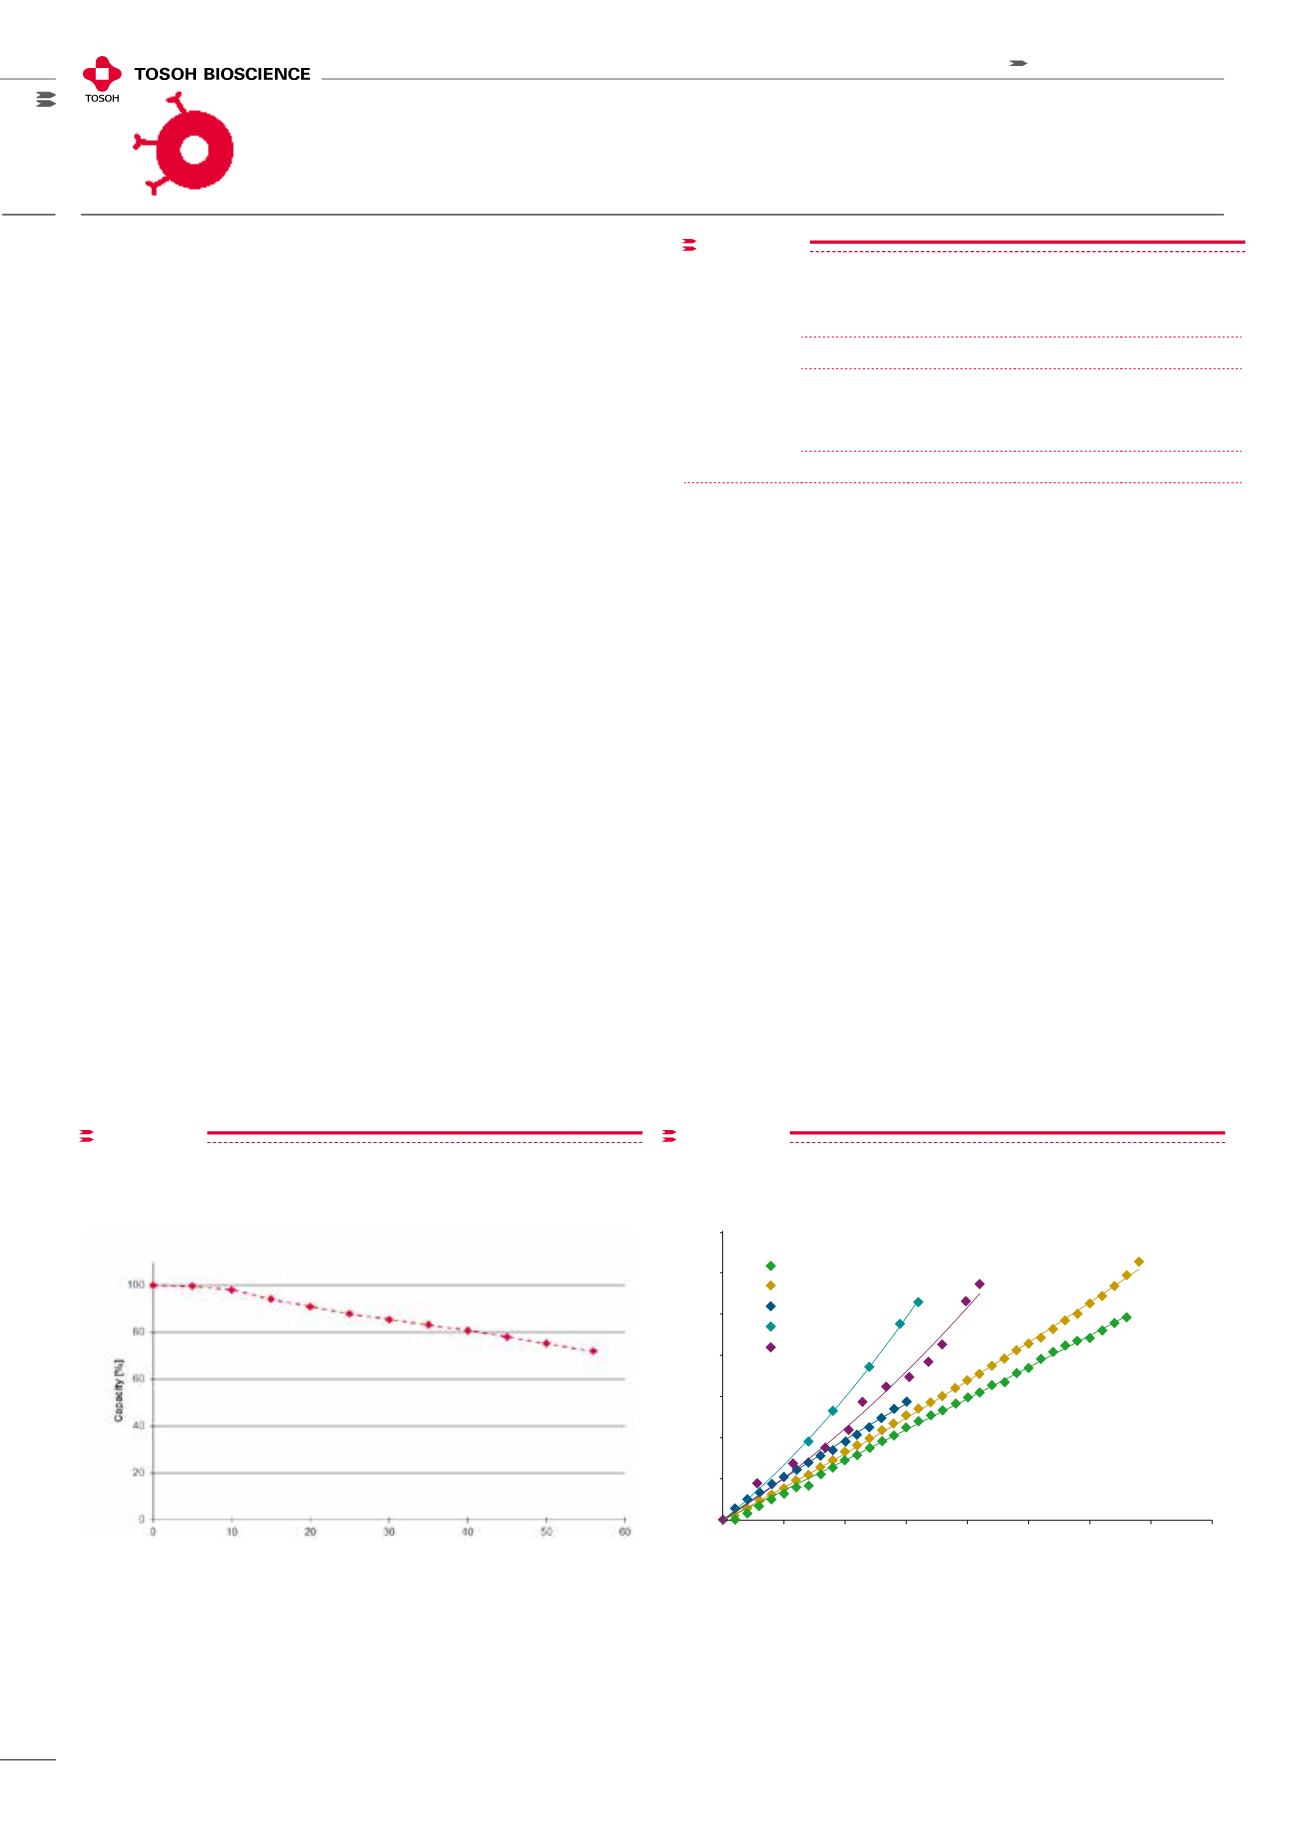
figure 5
Column size: 5 mm ID × 5 cm L; Wash procedure: A: 20 mmol/L Na
2
HPO
4
0.15 mol/L NaCl, pH 7.4 (10 CV)
B: 0.1 mol/L citrate, pH 3.0 (5 CV)
C: 20 mmol/L Na
2
HPO
4
, 0.15 mol/L NaCl, pH 7.4 (7 CV)
D: 0.5 mol/L NaOH (3 CV – 15 min contact time)
E: 20 mmol/L Na
2
HPO
4
, 0.15 mol/L NaCl, pH 7.4 (5 CV)
Capacity: DBC was determined at 10 % breakthrough after every 5 cycles
CIP Study with 0.5 M NaOH
Amount
of ligand
leakage
(ppm)
Before CIP
After 200 CIP cycles
Elution Buffer
Elution Buffer
citrate
(pH 3.0)
glycine-
HCI
(pH 3.0)
citrate
(pH 3.0)
glycine-HCI
(pH 3.0)
1.7
1.6
0.6
0.5
Amount of ligand leakage was determined with TOYOPEARL AF-rProtein A
HC-650F ELISA
ppm=µg/g IgG
Protein A Ligand leakage
TABLe I


