HIC
71
hic
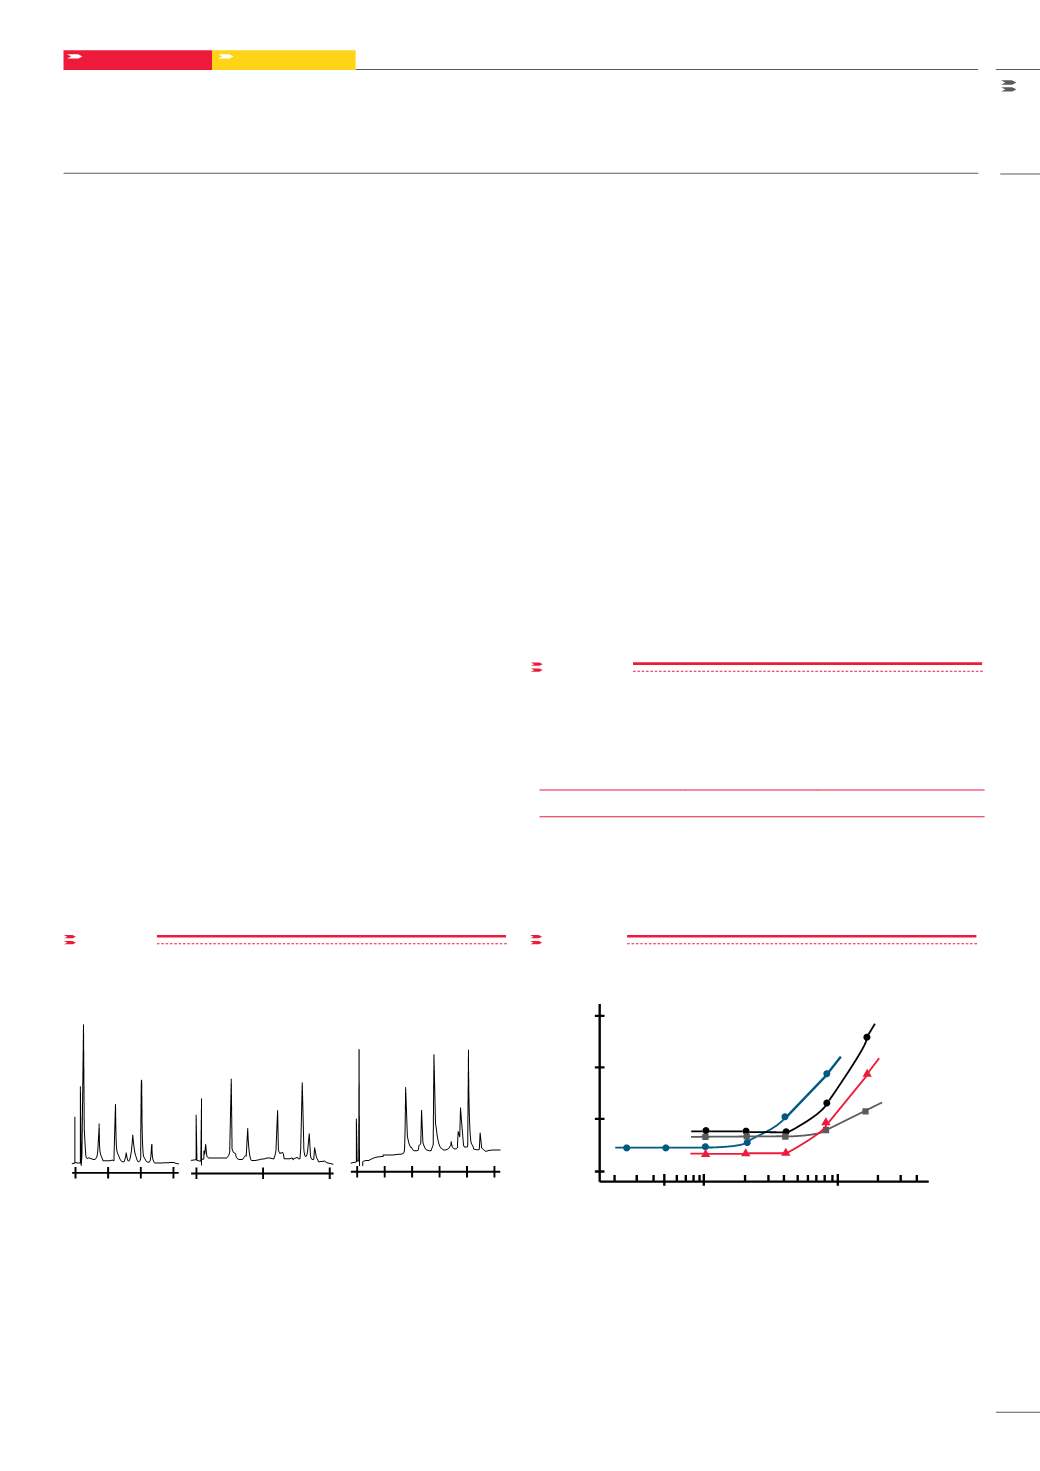
figure 2
Comparing HIC columns
Column:
Sample:
Injection:
Elution:
Flow Rate:
Detection:
TSKgel Ether-5PW & TSKgel Phenyl-5PW, 7.5mm ID x 7.5cm
TSKgel Butyl-NPR, 4.6mm ID x 3.5cm
1. myoglobin, 2. ribonuclease A, 3. lysozyme,
4.
α
-chymotrypsin, 5.
α
-chymotrypsinogen
5PW-type columns: 100µL (50-100µg);
NPR-type column: 20µL (1.5-40µg)
60min linear gradient from 1.8mol/L to 0mol/L (NH
4
)
2
SO
4
in 0.1mol/L phosphate buffer, pH 7.0, for 5PW-type columns;
12min linear gradient from 2.3mol/L to 0mol/L (NH
4
)
2
SO
4
in 0.1mol/L phosphate buffer, pH 7.0 for TSKgel Butyl-NPR
1.0mL/min
UV @ 280nm
Comparing conventional and nonporous HIC columns
Minutes
1
2
3
5
4
Butyl-NPR
0 2 4 6 8 10
1
2
3
4
5
Ether-5PW
0 15 30 45 0
30
60
1
2
3
5
4
Phenyl-5PW
Minutes
Minutes
Comparison of selectivity
Figure 2
compares the separation of standard proteins on the Ether,
Phenyl, and Butyl supports under similar operating conditions.
Sample capacity
One definition of sample capacity is the amount of pure compound
injected onto the column at which the peak width is 10% larger than
the peak width under low loading conditions. Using this definition, the
capacity of a 7.5 mm ID x 7.5 cm L TSKgel Phenyl-5PW column varies
from 0.1 to 1 mg of protein. Resolution and peak width are dependent on
sample loading, as shown in
Figure 3
. Therefore, sample loading should
be kept within 0.1 - 0.5 mg in order to obtain the highest resolution.
Separations on TSKgel Ether-5PW columns usually take 30 - 60 minutes.
0.5 mg of pure protein can be purified from a 5 - 10 mg crude protein
mixture using a 7.5 mm ID x 7.5 cm L column.
Since almost all of the surface area of a porous particle is inside the
pores, the capacity of the 4.6 mm ID x 3.5 cm L TSKgel Butyl-NPR
column is significantly less than that for the 7.5 mm ID x 7.5 cm L Phenyl-
5PW column. Capacities for the Butyl-NPR column are 100 µg for crude
sample and 2 µg for pure sample.
Chemical stability
TSKgel 5PW-type HIC columns are physically and chemically stable in
water soluble organic solvents (at < 50% methanol, ethanol, ACN, DMF,
DMSO or < 30 % chloroform). Change the solvent gradually by reducing
the flow rate (preferably with a gradient) because rapid change may
cause degradation of column efficiency. Note: When changing to an
organic solvent, reduce the salt concentration to prevent precipitation
of the salt on the column. Also, chaotropic agents (urea, SDS, etc.) will
reduce the adsorption of biomolecules; therefore, use low levels of
these agents (<2 mol/L).
Polymer-based columns are stable when cleaning at alkaline pH. All
TSKgel HIC columns can be routinely operated from pH 2-12.
Table II
shows that the phenyl groups on the TSKgel Phenyl-5PW are stable for
more than 10 days upon exposure to 0.5 mol/L NaOH or 0.5 mol/L acetic
acid.
figure 3
Dependence of peak width on sample loading in the separation of
proteins
Column: TSKgel Eth r-5PW & TSKgel Phenyl-5 W, 7.5 mm ID x 7.5 cm L
TSKgel Butyl-NPR, 4.6 mm ID x 3.5 cm L; Sample: 1. yoglobin,
2. ribonuclease A, 3. lysozyme, 4.
a
-chymotrypsin, 5.
a
-chymotrypsinogen;
Injection: 5PW-type columns: 100 μL (50-100 μg), NPR-type column: 20 μL (1.5-
40 μg); Elution: 60 min linear gradient from 1.8 mol/L to 0 mol/L (NH
4
)
2
SO
4
in 0.1 mol/L phosphate buffer, pH 7.0, for 5PW-type columns; 12 min linear
gradient from 2.3mol/L to 0 mol/L (NH
4
)
2
SO
4
in 0.1 mol/L phosphate buffer,
pH 7.0 for TSKgel Butyl-NPR; Flow rate: 1.0mL/min; Detection: UV @ 280 nm
Column: TSKgel Phenyl-5PW, 7.5 mm ID x 7.5 cm L; Sample: 1. myoglobin;
2. ribonuclease A; 3. ovalbumin; 4.
a
-chymotrypsin; concentration: 0.025
% to 1.6 %; Elution: 60 min linear gradient of (NH
4
)
2
SO
4
from 1.5 mol/L to
0 mol/L in 0.1 mol/L phosphate buffer (pH 7.0); Flow rate: 0.5 mL/min;
Temperature: 25 °C; Detection: UV @ 280 nm
Acid/base
Phenyl content (mmol/mL - resin)
Before exposure
After 10 days
exposure
0.5 mol/L CH
3
COOH
0.105
0.106
0.5 mol/L NaOH
0.105
0.104
TABLE II
Long-term exposure of TSKgel Phenyl-5PW to acid and base
Dependence of peak width on sample loading in the
separation of proteins
Column:
TSKgel Phenyl-5PW, 7.5 mm ID x 7.5 cm L
Sample:
1. myoglobin; 2. ribonuclease A; 3. ovalbumin;
4.
α
-chymotrypsin; concentration: 0.025 % to 1.6 %
Elution:
60 min linear gradient of (NH
4
)
2
SO
4
from 1.5 mol/L t
0 mol/L in 0.1 mol/L phosphate buffer (pH 7.0)
Flow Rate:
0.5 mL/min
Temperature:
25
°
C
Detection:
UV @ 280 nm
Sample Loading (mg)
Peak Width (mL)
4
2
1
3
0.1
1.0
1.0
1.5
2.0
2.5
Sample Loading (mg)


