69
afc
Affinity
chromatography
0
10
20
30
40
50
4
5
6
7
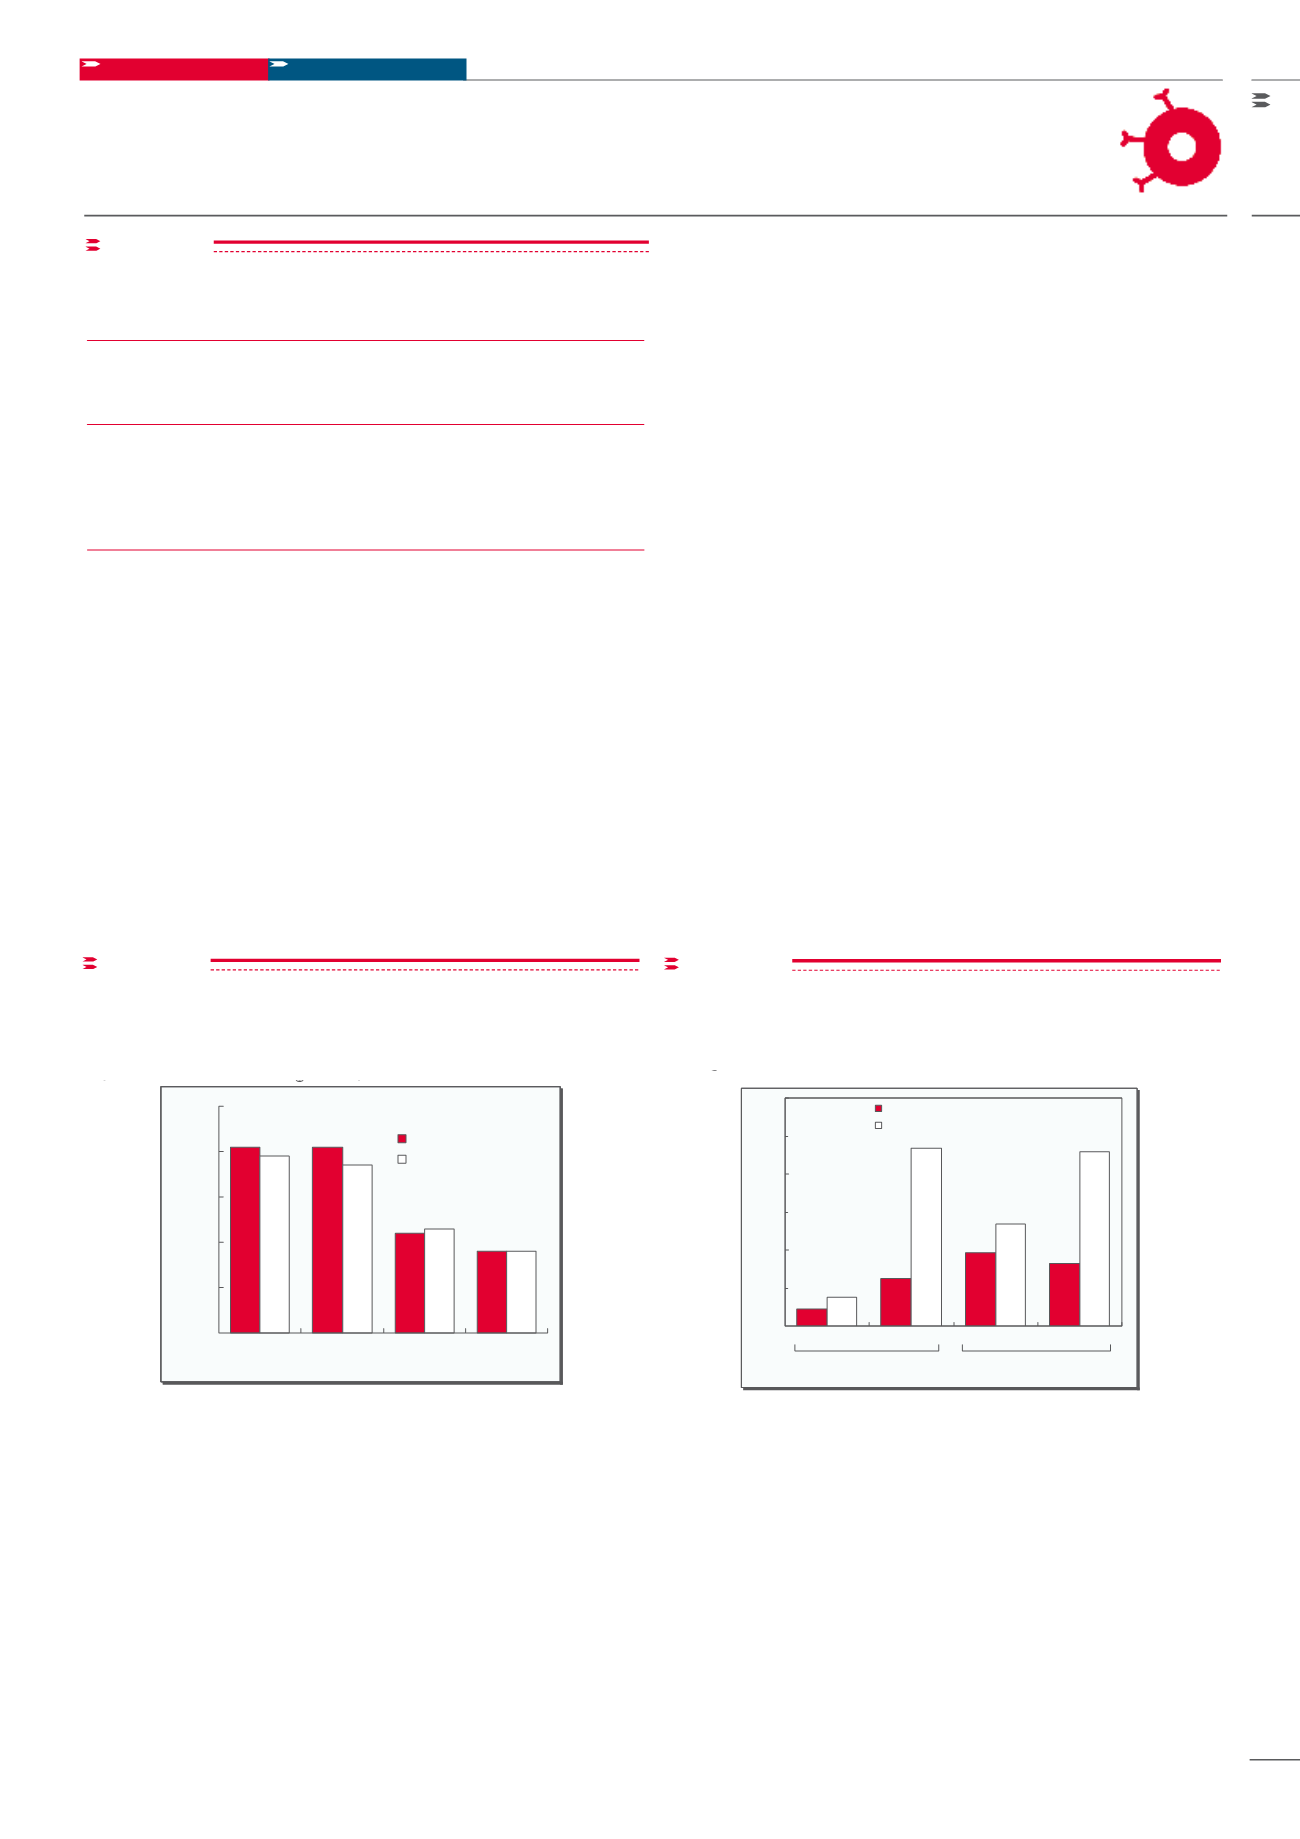
HSA binding capacity (g/L)
AF-Blue HC-650M
Agarose
0
pH
HSA binding capacity (g/L)
-Blue HC-650M
arose-Blue
Conditions
- A 1.0mL of adsorbent was washed with 10mL of equilibration buffer
(pH 4.0 and 5.0; 0.1mol/L sodium acetate buffer, pH 6.0 and 7.0; 0.1mol/L
sodium phosphate buffer).
- A 5.0mL of 1 % solution of human albumin desolved in each equilibration
buffer was charged onto the column.
- After 10 min, unbound albumin was eluted and the column was washed
with 10mL of each equilibration buffer.
- Adsorbed human albumin was eluted with 0.1mol/L sodium phosphate
buffer at pH 7.0 containing 2.0mol/L sodium chloride (desorption buffer)
and 10mL fractions were collected.
- Human albumin content was measured spectrophotometrically by using
E 0.1% at 280nm = 0.55.
Comparison of human serum albumin binding capacities
at various pHs of AF-Blue HC-650M and Agarose
(blue functionalized agarose)
Conditions
- A 1.0 mL of dsorbent was washed with 10 mL of equilibration
buffer (pH 4.0 and 5.0; 0.1 mol/L sodium acetate buffer, pH 6.0 and 7.0; 0.1
mol/L sodium phosphate buffer).
- A 5.0 mL of 1 % solution of human albumin desolved in each
equilibration buffer w s charged onto the column.
- After 10 min, unbound albumin was eluted and the column was washed with
10 mL of each equilibration buffer.
- Adsorbed hu an albumin was eluted with 0.1 mol/L sodium
phosphate buffer at pH 7.0 containing 2.0 mol/L sodium chloride
(desorption buffer) and 10 mL fractions were collected.
- Human albumin content was measured spectrophotometrically by using E
0.1 % at 280 nm = 0.55.
figure 8
Comparison of human serum albumin binding capaci-
ties at various pH’s of AF-Blue HC-650M and Agarose
(blue functionalized agarose)
0
5
10
15
0.1 mol/L
0.5 mol/L
0.1 mol/L
0.5 mol/L
Solvent
TOYOPEARL AF-Blue HC-650M
Agarose Blue
NaOH
HCl
Conditions
200mg of each material was suspended in 4mL of solvent and
incubated at 25°C and shaking for 24h. The absorption at 620nm of
the supernatants were measured after appropriate adjustment to
neutrality with known volume of acid or base. Dye concentrations
were estimated assuming a molar extinction coefficient of
12,750 (L/M cm).
Comparative dye leakage study of AF-Blue HC-650M and
Agarose Blue @ 25°C (after 24 hours)
Cibacron Blue 3GA conc. (µmol/L)
Conditions:
200 mg of each material was suspended in 4 mL of solvent and incu-
bated at 25 °C and shaking for 24 h. The absorption at 620 nm of the
supernatants were measured after appropriate adjustment to neu-
trality with known volume of acid or base. Dye concentrations were es-
timated a suming a molar extinction coefficient of 12,750 (L/M cm).
figure 9
Comparative dye leakage study of AF-Blue HC-650M and
Competitor Blue @ 25 °C (after 24 hours)
Representative Binding Capacities for TOYOPEARL Dye-
Ligand Affinity Media
Table III
Protein
AF-Blue HC-650M AF-Red-650ML
(mg/mL res±in)
Hexokinase
3
-
Bovine serum albumin
16
-
Human serum albumin
18
±
2.5
3.5
±
1
Lactate dehydrogenase
27
11


